
Costa Mesa Middle and High School has designed a student survey asking about students’ experience in and outside of school and to learn more. It focuses on topics such as: transportation, homework, attendances/tardies, lunches, outside activities and our vending machines. With the help of our Math and Data Science teacher, Dr. Whitney, and some of our hard working seniors, questions were created for students’ thoughts and opinions about what’s new on campus.
This goal is to better understand what students may feel or go through in our community and on campus to help improve the school, to analyze the data to understand why some restrictions or effects happen with students to solve any issues and workloads in CMMHS. With these topics, this survey will explore the difference in students and the results to gather the insights. Student feedback is important to helping the CMMHS community. The information can be collected for what needs attention and some challenges students may encounter.
Firstly, it’s asked about commuting to school and the different types of transportation if it can be improved. Students could have problems on the way, such as traffic, long car lines into the school, crowded public transportation, or distance from where they live. This causes tardies or trouble for parents getting out of the school after dropping their student off. With the new e-bike policy rule this year, this also causes problems if kids need to find new ways for transportation to school.
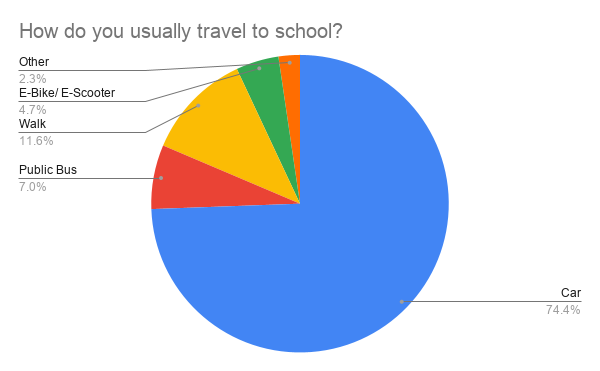
With the results submitted, the biggest result is that students usually travel by car, or a small percentage travel by walking to school. More than half of students are never tardy of their mode of transportation. But, some students are tardy once or a few, or even more than 10 times tardy because of transportation! In the survey, students were asked if they feel safe traveling to school. Good enough, 65% always feel safe, but unfortunately others were between usually or never.
Secondly, the survey asks about homework, interested in the workload between different grades. It asks about how much work is assigned and how much they work on a typical day, how many times a week they turn in late homework and how often they use AI. Some classes may assign too much work during the period, and if students have too many classes that do this it will keep them away from having any rest when they are home. Some students do activities or work after school, this could cause too many late turn-in with students’ busy schedules.
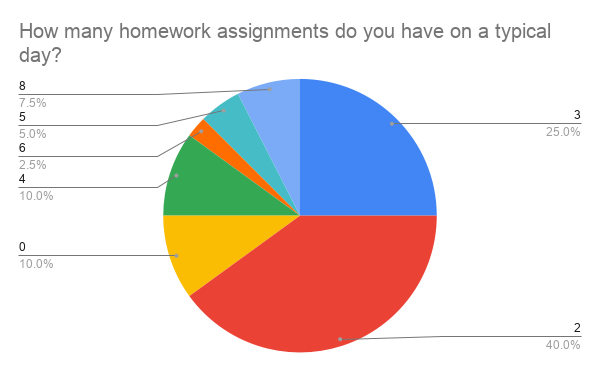
With the chart they have, 40% of responses have 2 assignments on a typical day, and 20% of 3 assignments on a day. The rest is usually more than 4 assignments on a typical day. Students also mostly work on 2 assignments on a typical day. The rest usually work on 1, 3 or 4 assignments on a typical day, either none or surprisingly work on more than 5 assignments! 32.5% of students generally never turn in late assignments, or 17.5% 1-3 late assignments each week. Lastly, 39.5% of students never use AI, 16.3% sometimes, 23.3% occasionally, 4.7% often and 11.6% always. The rest prefers not to answer.
The survey also asks about lunches at school. This slide asks about school provided lunches, how often students eat school lunch, how much they may throw away, and why they mainly get the lunches our school provides. Like for the juice or milk or the small snacks. This could help understand student’s lunch habits with the food they consumed being served at our school community.
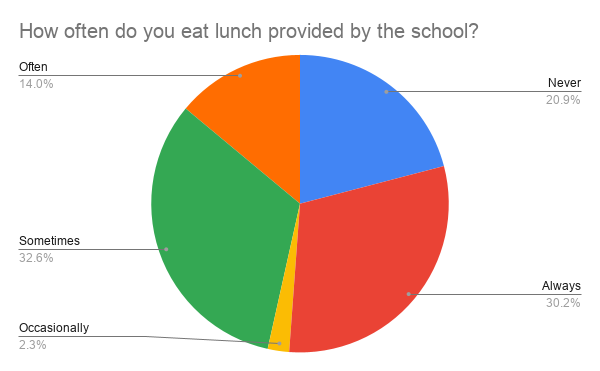
More than half of the students always or sometimes eat the school lunch. 14% often, 20.9% never, and 2.3% occasionally do. Then, 55% of the students eat most of their lunch. 32.5% throw most of it away, and the rest prefers not to answer. Next, 43.9% of the students never get lunch just for beverages, and 26.8% sometimes do; the rest occasionally or often does. Along with that, 40.5% never get lunch for smaller snacks, and 31% sometimes do. The rest always or occasionally do.
The survey then asks about our schools vending machines. It asks how often students purchase items from the vending machines, what times during school they buy from the machines, and how much money they may spend per visit. This could help understand any problems students may have with the vending machines, if students really use the machines and who chooses not to use them.
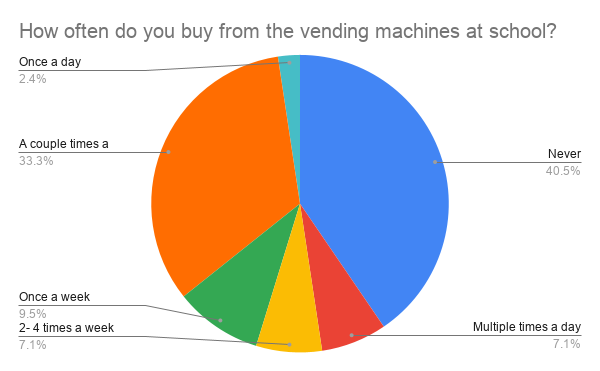
Almost half of the students never buy from the vending machines, and 33.3% do couple times a month. The rest does once or more times a day or week. Then 28.9% buy from the machines after school, 13.2% buy before school or during lunch. The rest generally does at nutrition, class or doesn’t answer. Lastly, 40.5% of student spend no money on the vending machines. 27% spend only 3$, 13.5% spend 2$, 10.8% spends 4$ and 8.1% spends 5$ at the vending machines.
Next, they ask students about after school activities. Whether how many and what activities kids participate in, how many days typically do they do after school activities, and if students ever arrive late or have to leave early because of an activity. If students are volunteering for after school activities, like sports, clubs, works or a program, this gives a general idea how many students in our school are really involved outside of school! The information may help show how activities impact kids schedules and the responsibilities they offer to take.
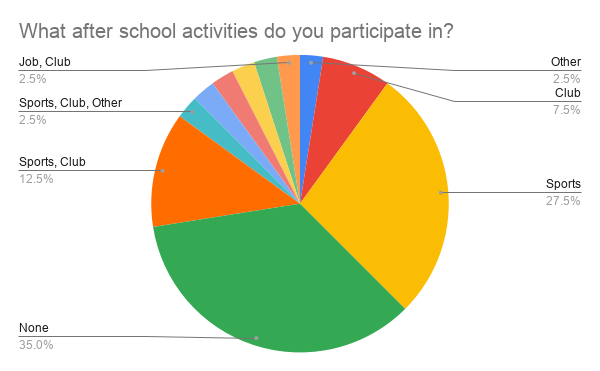
With the results, 35% don’t do any activities after school. But, 27.5% do sports, 7.5% do clubs and 12.5% do both sports and clubs. The smaller percentages do multiple activities. Asides from thee 35% that do none, 20.5% of students do 5 typically a week, 10.3% do 2 or 3 days. The rest typically do almost the whole week or less than 4 days. Lastly, more 80% of students aren’t ever late to school, and 70% also don’t have to leave early because of an activity.
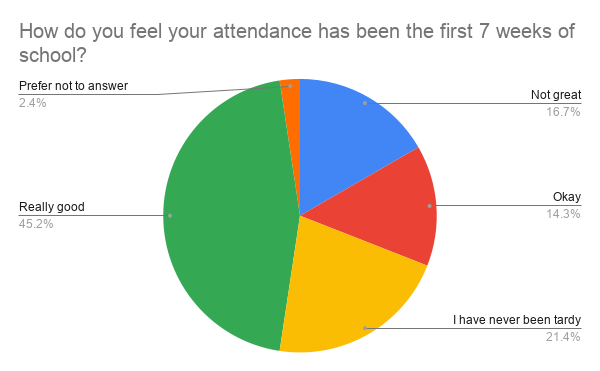
The next part wonders about student attendances, interested in restrictions that cause students to be late. The main two questions were they wonder how students feel about their attendance the first 7 weeks of school, and the general reason for their tardies during their periods of the day.
So, almost 50% of students feel really good about their attendance the first 7 weeks, 21.4% have never been tardy, 4.3% feel okay, and 16.7% not so great. The rest doesn’t answer. With the students that are tardy, their reasons are because 14.3% waking up late, traffic, or taking their siblings to school. The rest are time, gas or any other reasons.
Lastly, the survey asks about how students feel people treat them. Whether they feel different in school compared to outside of school. This information could show if students ever have trouble with connection, or if some are known by a lot of people, generally if there’s a big difference with how students are treated. It asks how often do people greet them during or outside of school, considered themselves well known at or outside of school, and if students would say they are the same person compared to outside of school.
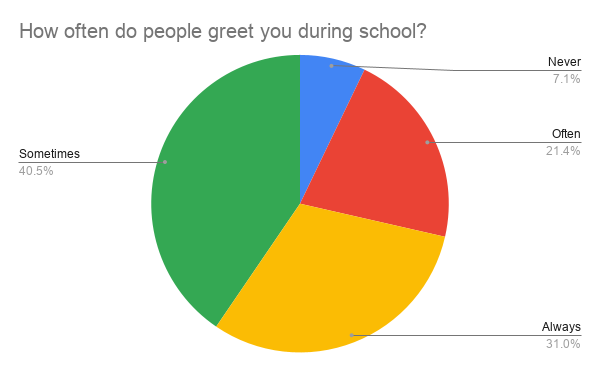
Counting the most percentages, 40.5% are sometimes greeted in school and 28.6% are often greeted outside of school. Next, 45% consider themselves well known in school and 40% don’t feel as known outside of school. Lastly, 42.9% of students would say they are the same person compared to outside of school, 28.6% say maybe, and 23.8% don’t think they are the same. The rest doesn’t prefer to answer.
Overall, this student community survey, designed by Dr. Whitney and some of our seniors, this survey give students a voice and helps the school understand better their experience of our community. This gathers information of different aspects of student life and aims to learn more of the preferences and challenges on what happens throughout their day. With the results, this could create a more positive environment for everyone at Costa Mesa Middle and High School.


